
Go back
Go back
untangling the coordination issue

Experimentation platform is an internal tool of Spotify where data scientists and product managers configure and run their experiments on the end user. The product is used by all teams across Spotify; who wish to make data-driven decisions.
Spotify
Experimentation Platform
6 months
Cross functional
Product Designer
We implemented a new flow based on user insights to streamline their journey.
With the help of interviews and the design studio workshop we got a clear picture of user pain points.

The new flow improved user satisfaction, with fewer complaints regarding collaboration.
The platform is highly technical and sometimes more complex than it needs to be, especially for novice users. My goal as a designer was to approach the product with a fresh eye while always keeping my focus on usability.
As a designer who joined a heavily engineer-based team, my primary mission was to introduce a user-centered point of view in decision-making processes. I was a constant advocate for the user in every aspect. To gain trust, I collaborated with the data scientist, the user researcher for design outputs and created collaboration opportunities in earlier steps of product decisions with the engineer manager and product manager.
To prevent flickering experiences for our end users, experimenters in Spotify must consider other ongoing experiments when publishing something new. So experiments on conflicting properties are not allowed. Because we have a limited number of users to experiment on, experimenters must coordinate with each other.
What's more, the experimenters from different tribes than the surface owner tribe, must wait to run their experiments on congested surfaces like home.
The main pain point for the users was uncertainty because they were in total darkness about when they could run their experiment.
Since the product didn't tell them anything about this, the teams had to develop their own systems to find this information.
Initial solution was to the user clarity about timelines and improve their processes by eliminating unproductive time spent on this obscurity.

There are 4 main types of pain points to adress while designing any usability service, financial pain points, productivity pain points, process pain points and support pain points.
We have an active support channel on Slack where we answer user questions about the various parts of the platform daily. This medium is both a support channel for our users and an insight-gathering tool for us. We learn from their problems, and sometimes even get useful suggestions about these issues.

We've had to stand up a bit of process within our own team to avoid experiment collisions and with additional teams starting to experiment on our surfaces (conceptually), we may have to create more process to coordinate with teams experimenting on our surfaces (in EP).Team

It could be that I am not very informed but my issue is that Experiment Platform looks extremely easy to use, but at the same time it is extremely powerful and complex. So, without having enough knowledge it could be easy to screw something up without realizing it.

This situation increases the lead times in which to get to a viable MVP of a new feature
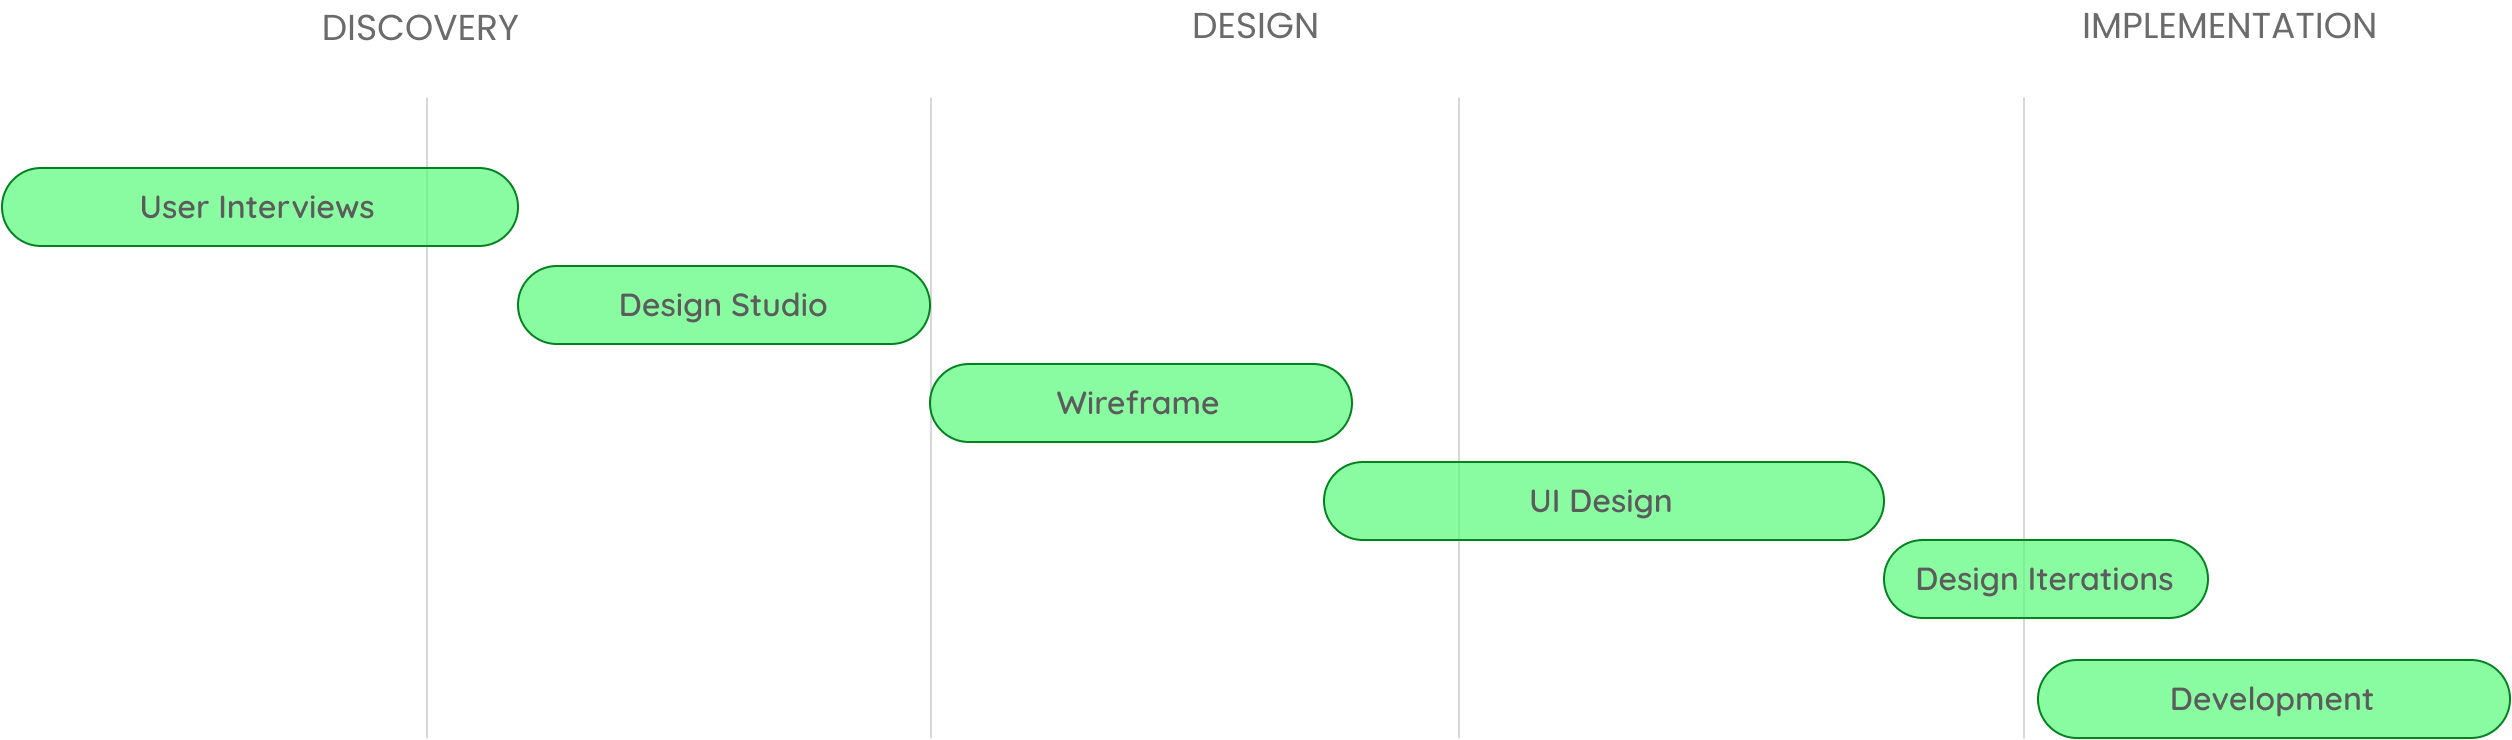
We got together with our data scientist before preparing for the interviews. Together we listed some insights we can collect with BigQuery. that will guide us on our interview process.
-When we checked the data about the user behavior and the experiments, we saw that coordination is a more critical problem to some surfaces than others.
-We realised that coordination was a huge problem for a small number of surfaces, but these surfaces form the majority of our users. So, this was a perfect example of a Pareto principle in work.
-We learned that some teams created their own organizational structures to take care of the coordination tasks.
-We found out that some teams have created their systems to follow up on coordination (like spreadsheets)
-Coordination appeared as the 2nd most prominent problem in last year's survey
The 80/20 rule, also known as the Pareto Principle, states that 80% of results in a system come from 20% of the causes.
After conducting interviews with 7 different users we started to cluster the insights into meaningful categories. After that we presented our findings to the team. including our plan for next steps.
- Communication
- Surface ownership
- Negotiation
- Lack of visibility
- Additional tools
- Different stress levels
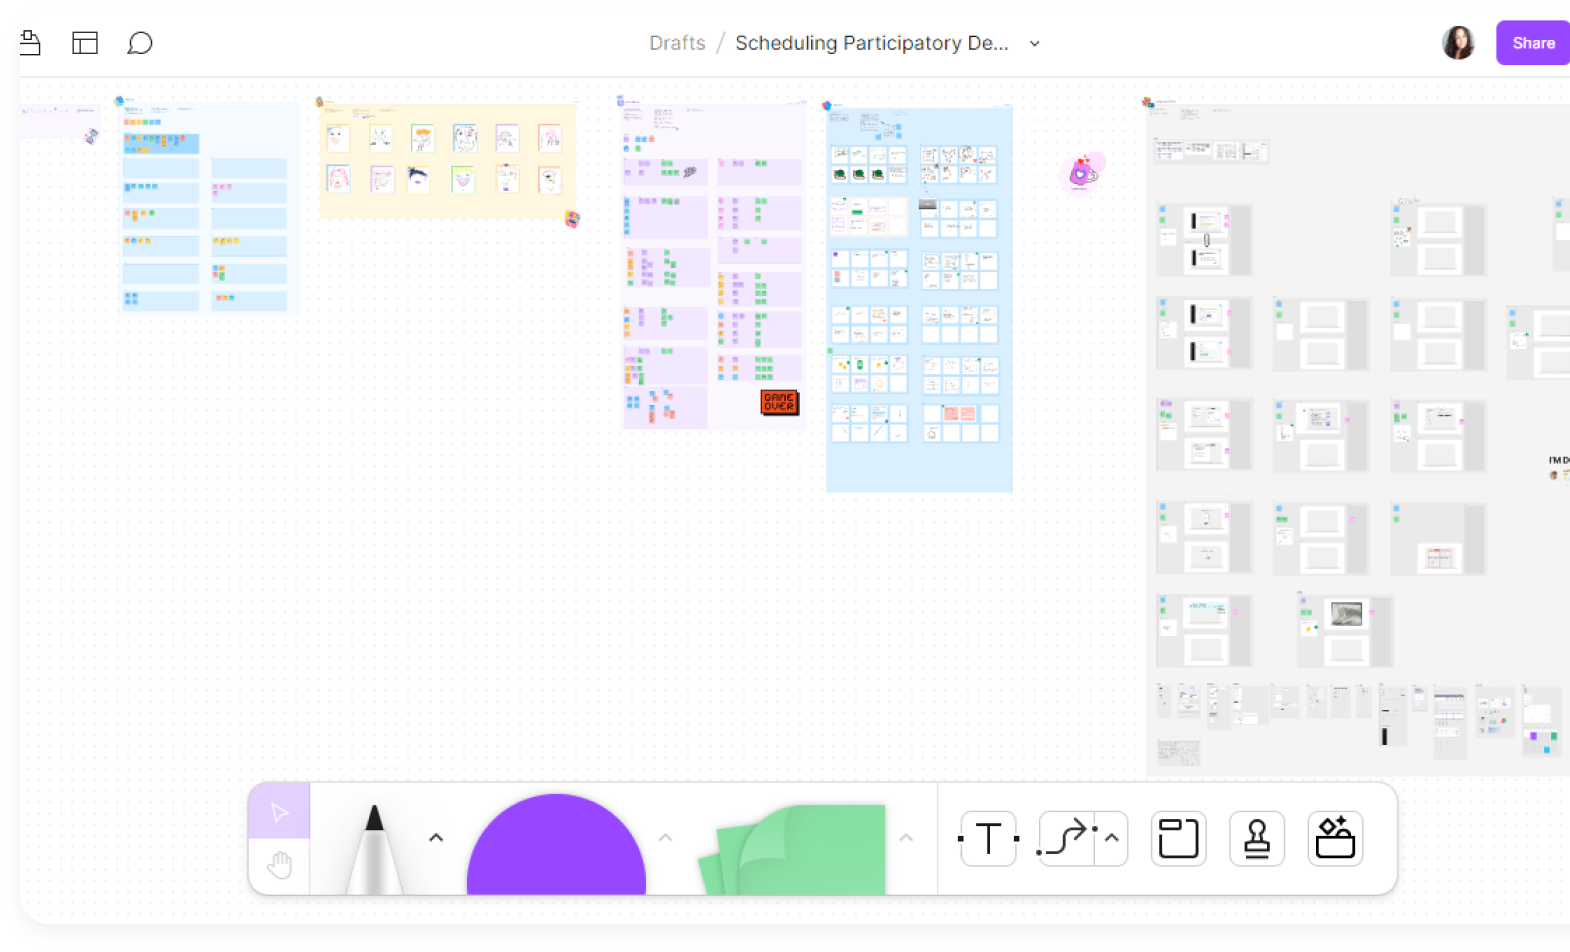
When the interviews were done. I designed a participatory design workshop where we will search for possible solutions or inspiration inspiration for the problem at hand. We created 2 sets of workshops dividing the the users into 2 group by their stress levels from the congestion.Before the actual workshop, we facilitated a demo session with the team. Which made them feel more involved in the design process and helped me make some tweaks on runtime before the actual sessions.
After the interviews and the participatory design workshop, a strong idea was shaped with insight from our users. We wanted to suggest solutions for;
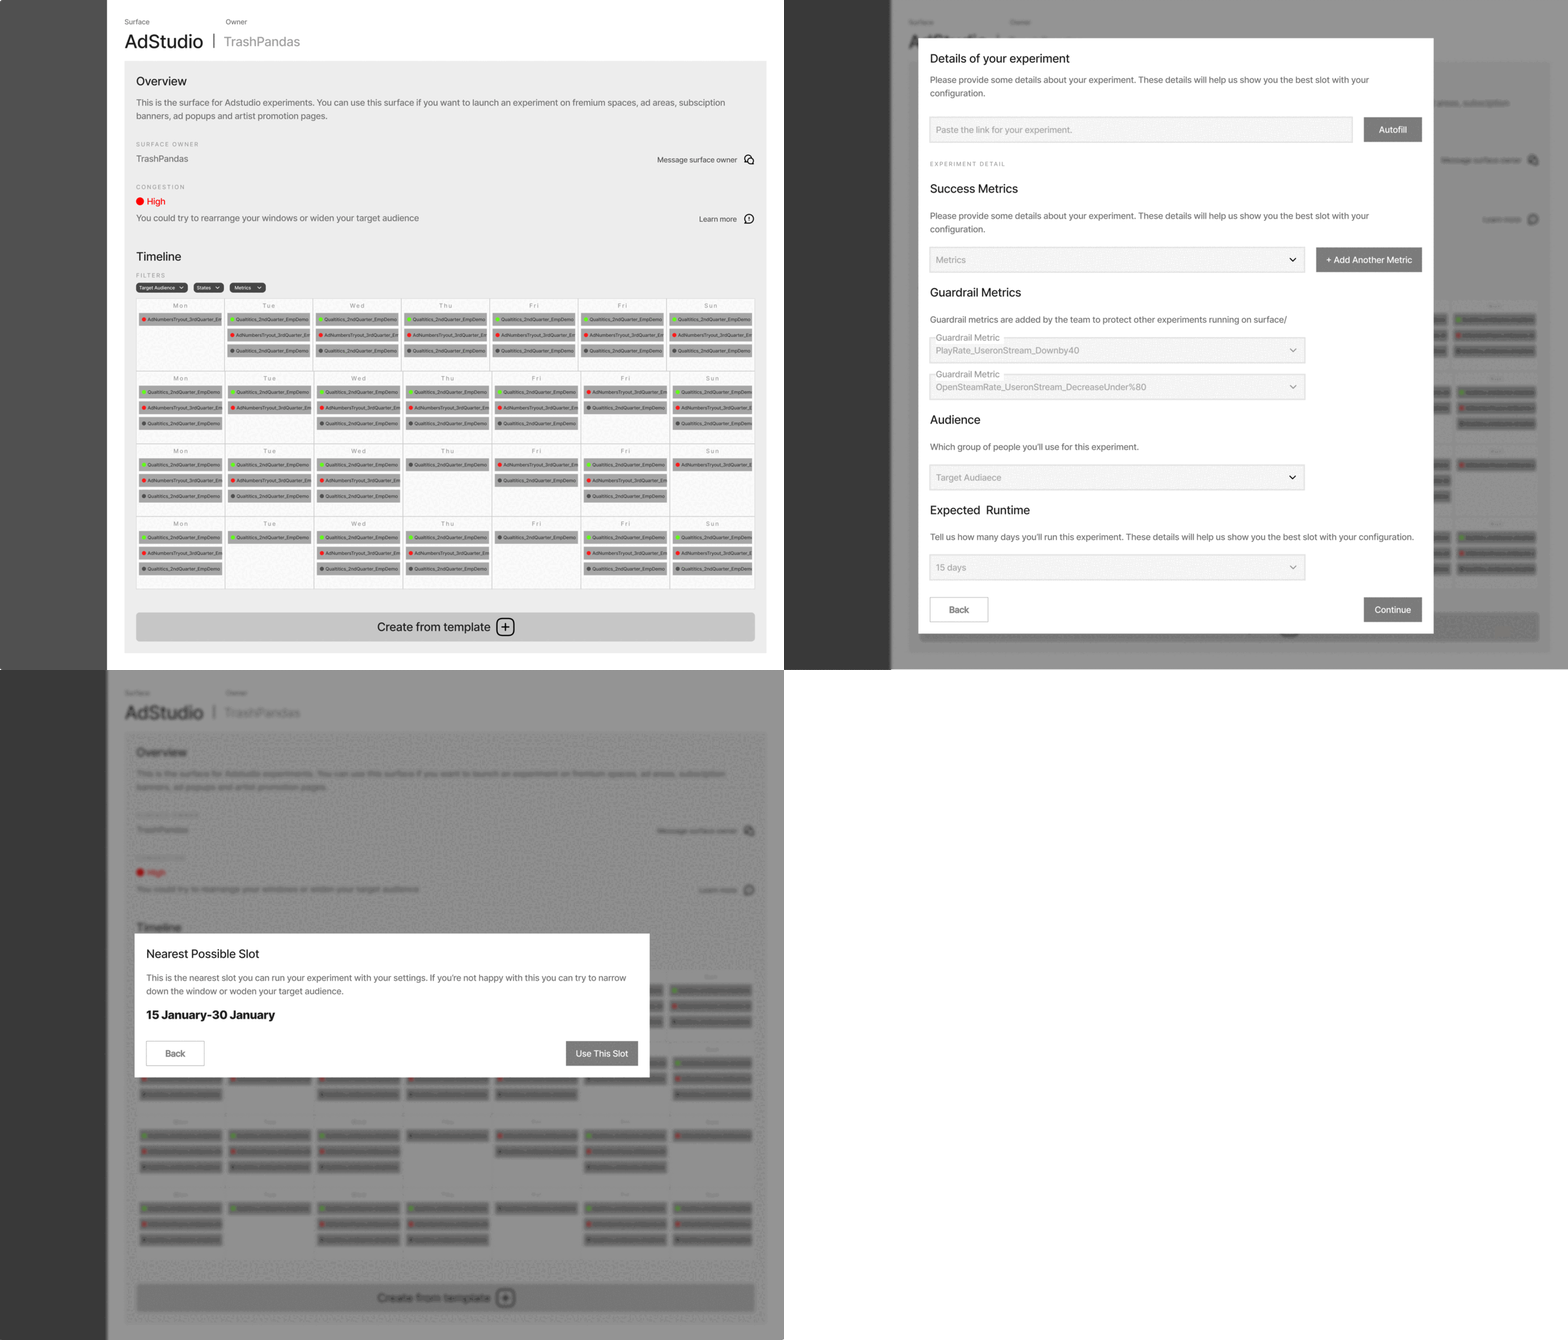
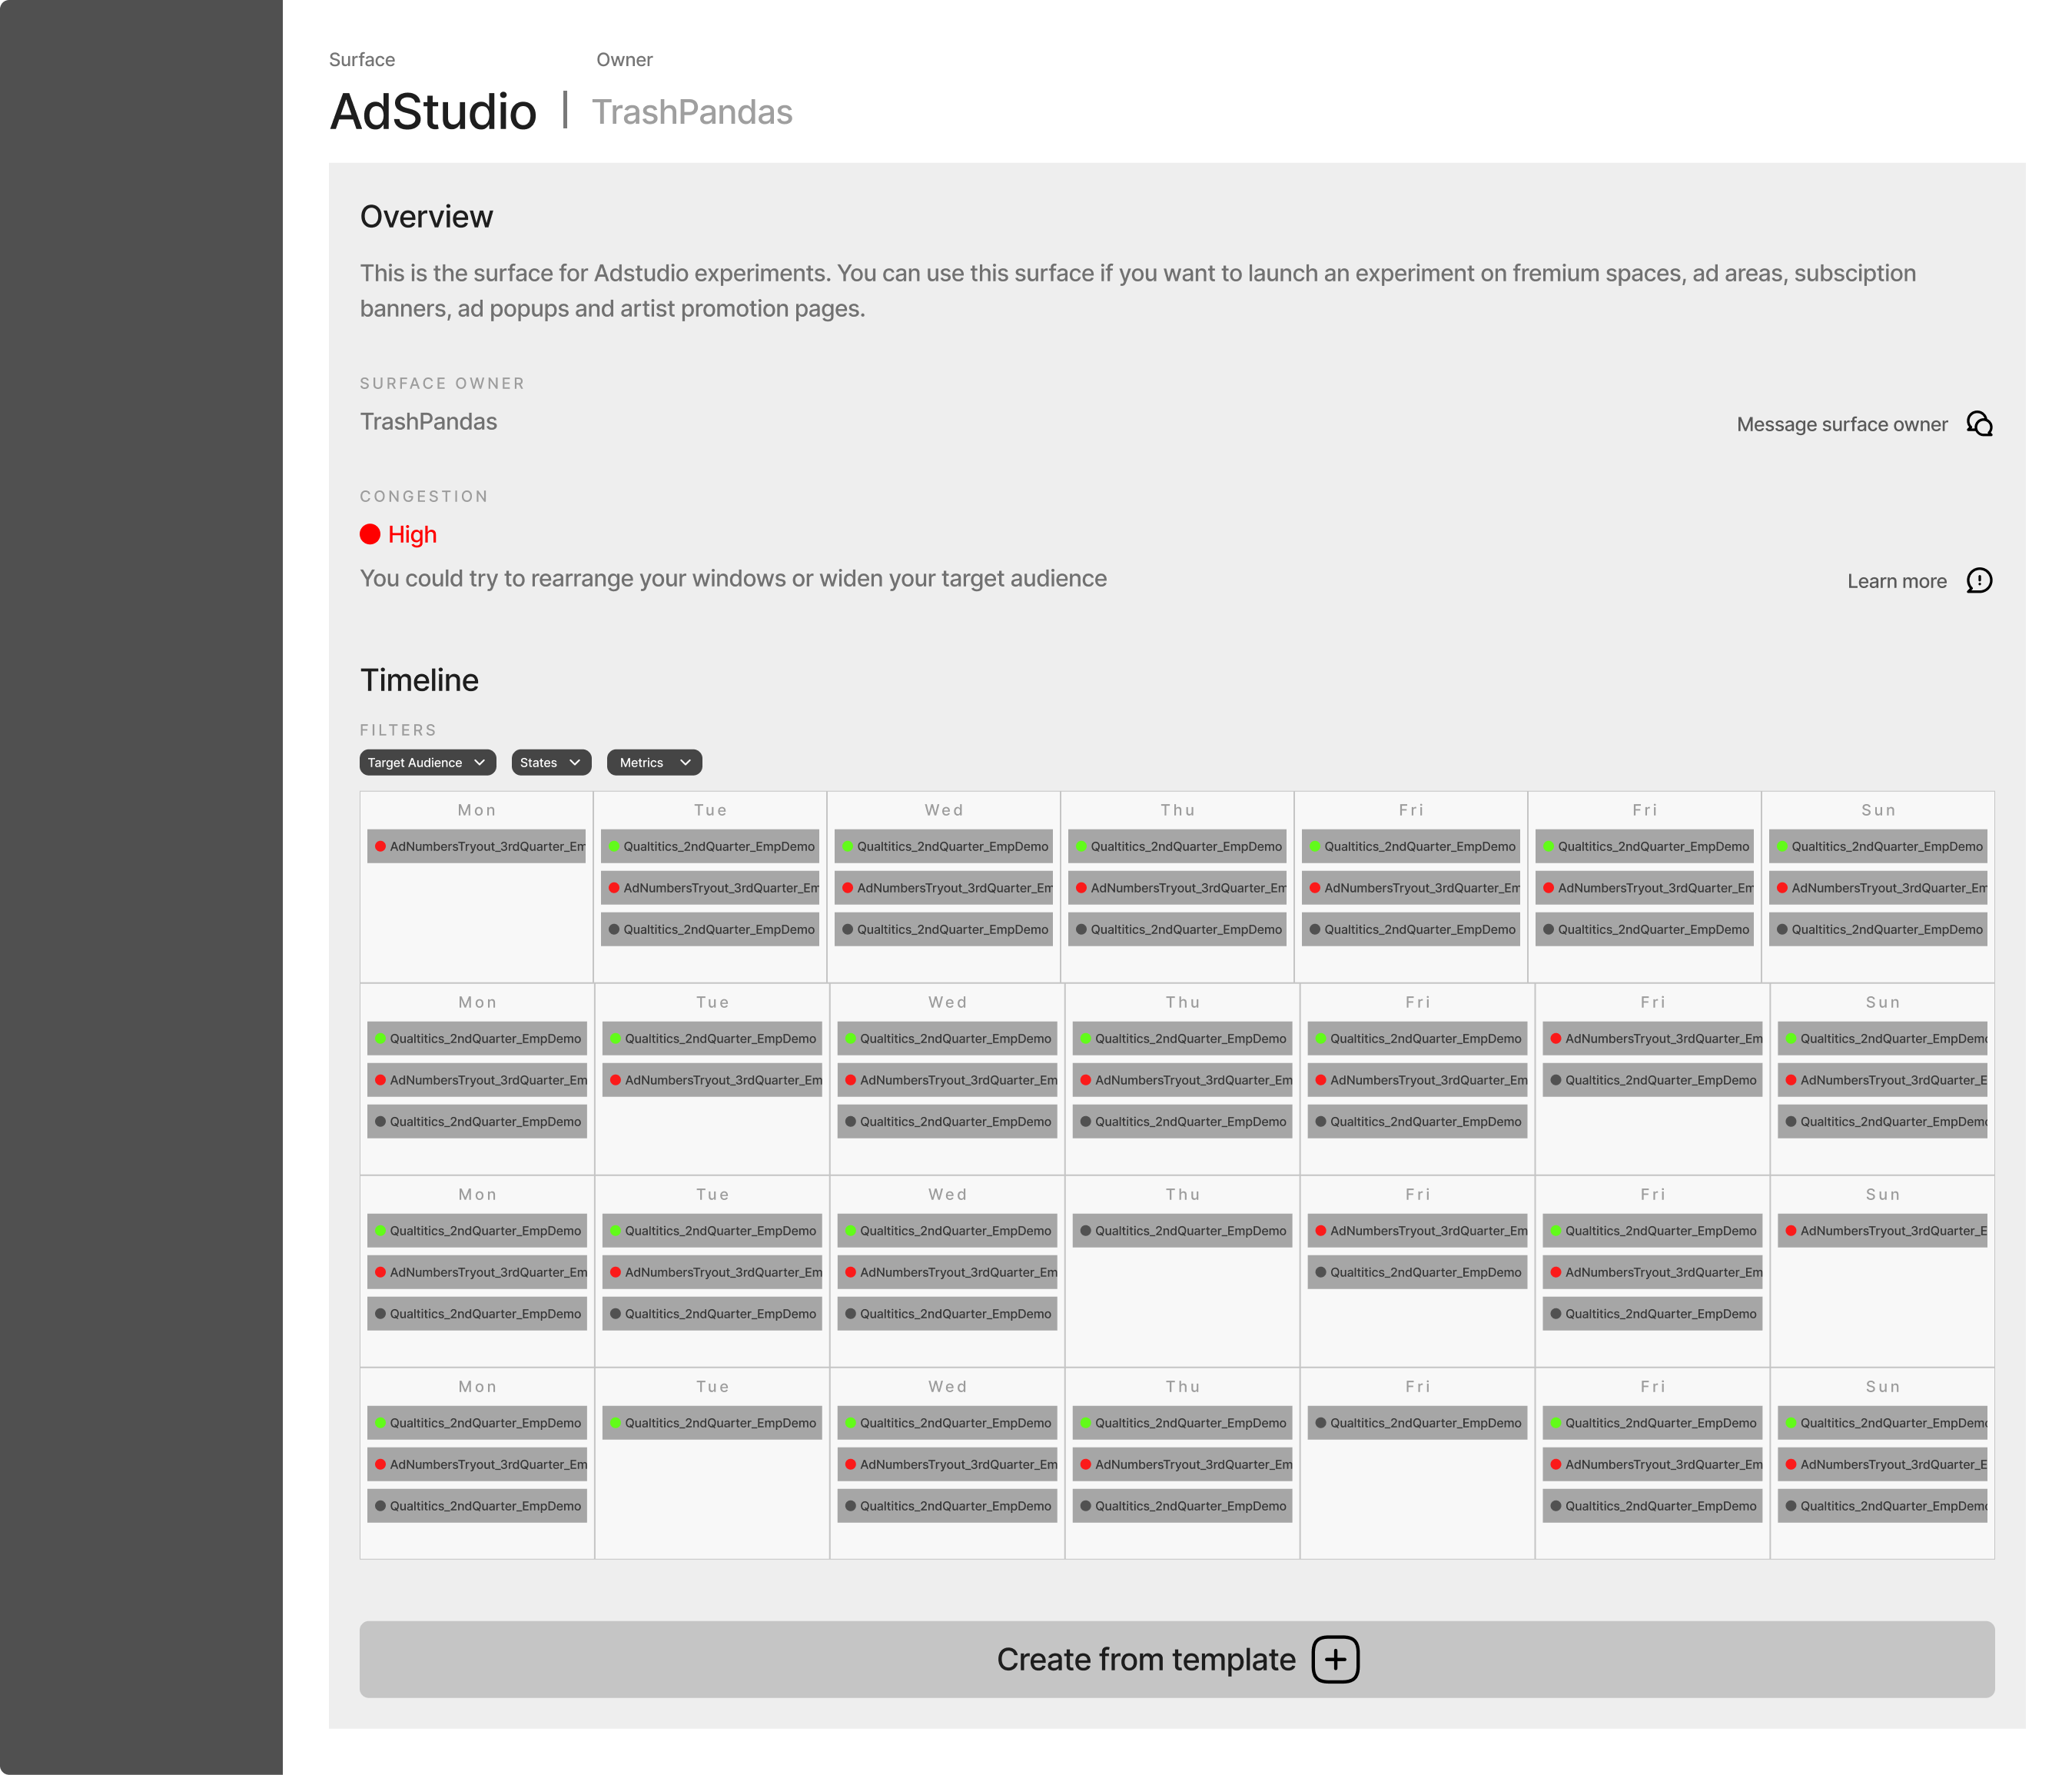
We wanted to include a visual representation of the surface timeline so people could see the congested areas and make their decisions accordingly.
By adding a direct way to contact the surface owner's selected slack channel, we made it easier for people to reach out to the right people.
By adding a form, we wanted to decrease the back-and-forth between teams by adding a "need to have these to launch" form; also, this form is a good way to inform the proper surface owners about who wants to run an experiment on their surface
Giving an approximate possible timeline and enabling the user to act upon that slot relieves a big unknown.
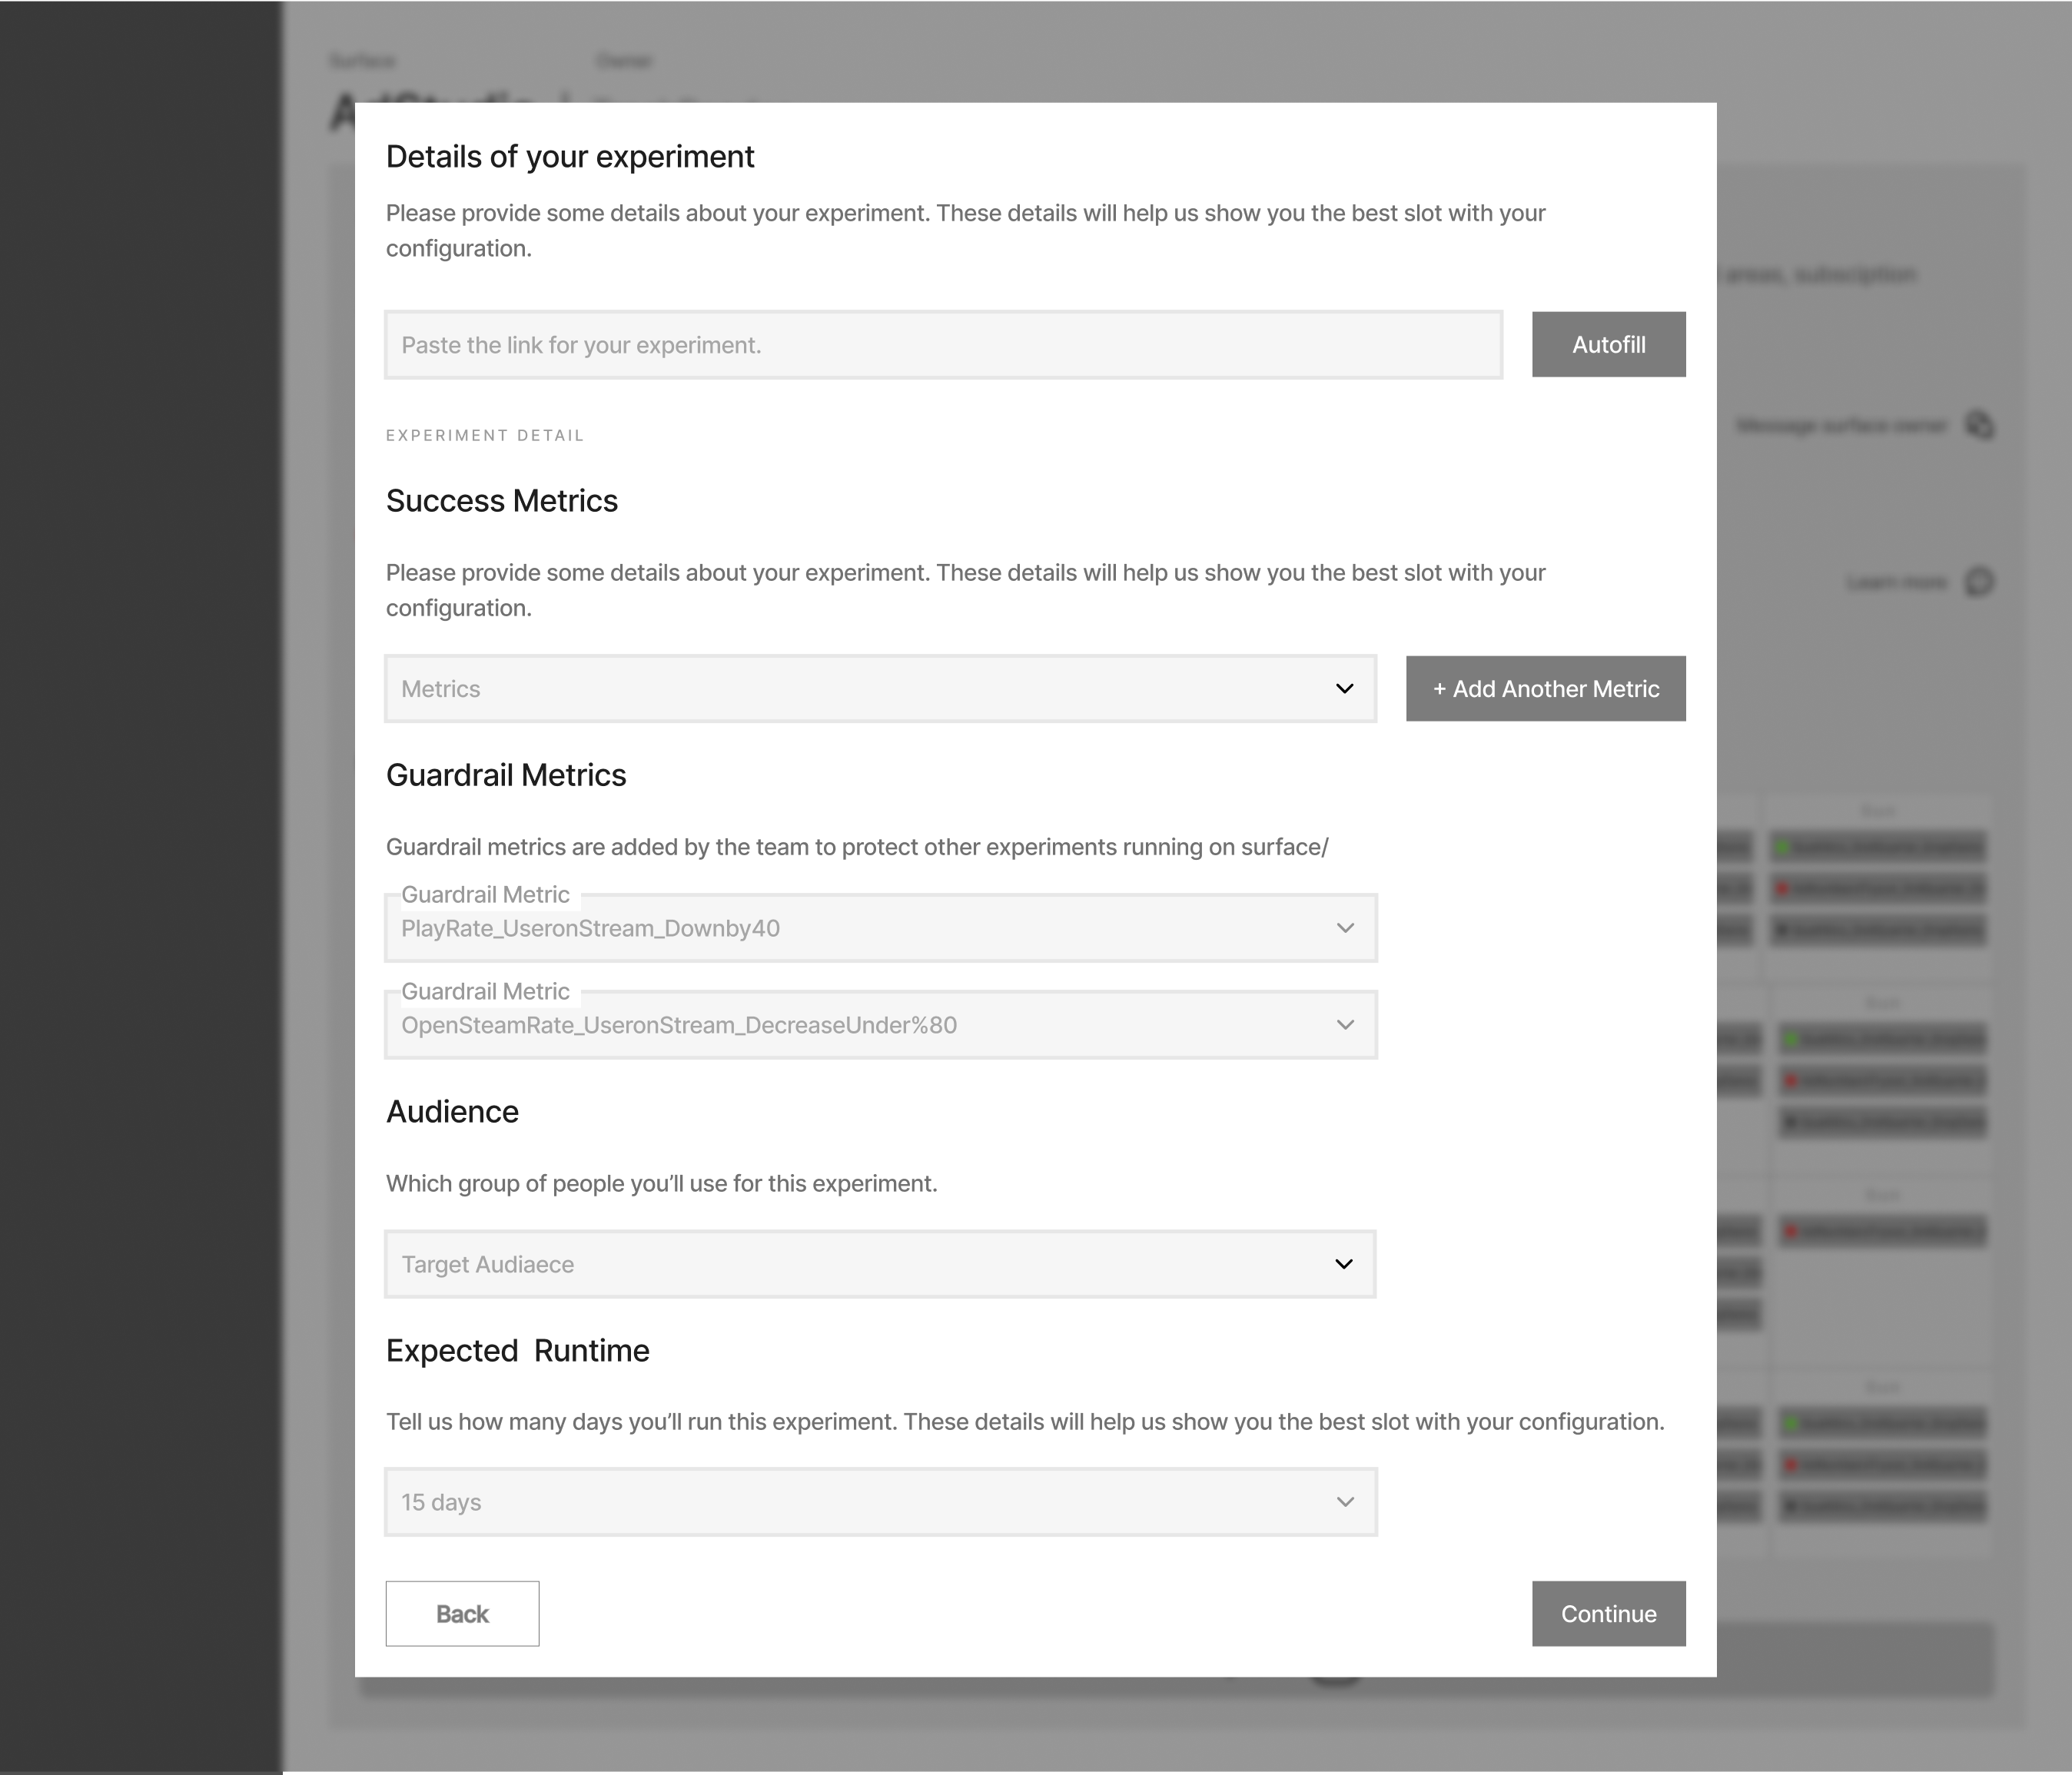
For the first step, we wanted to include some filters so people could settle for making minor alterations on their experiments to fit in.
Even though the wait can still be long, they have more information about what's going on behind the scenes. With this new framing, the users feel more in control.
The framing effect happens when your decision is influenced more by how the information is presented (or worded) than by the information itself. It's partly due to the fact that people evaluate their losses and acquire insight in an asymmetric fashion
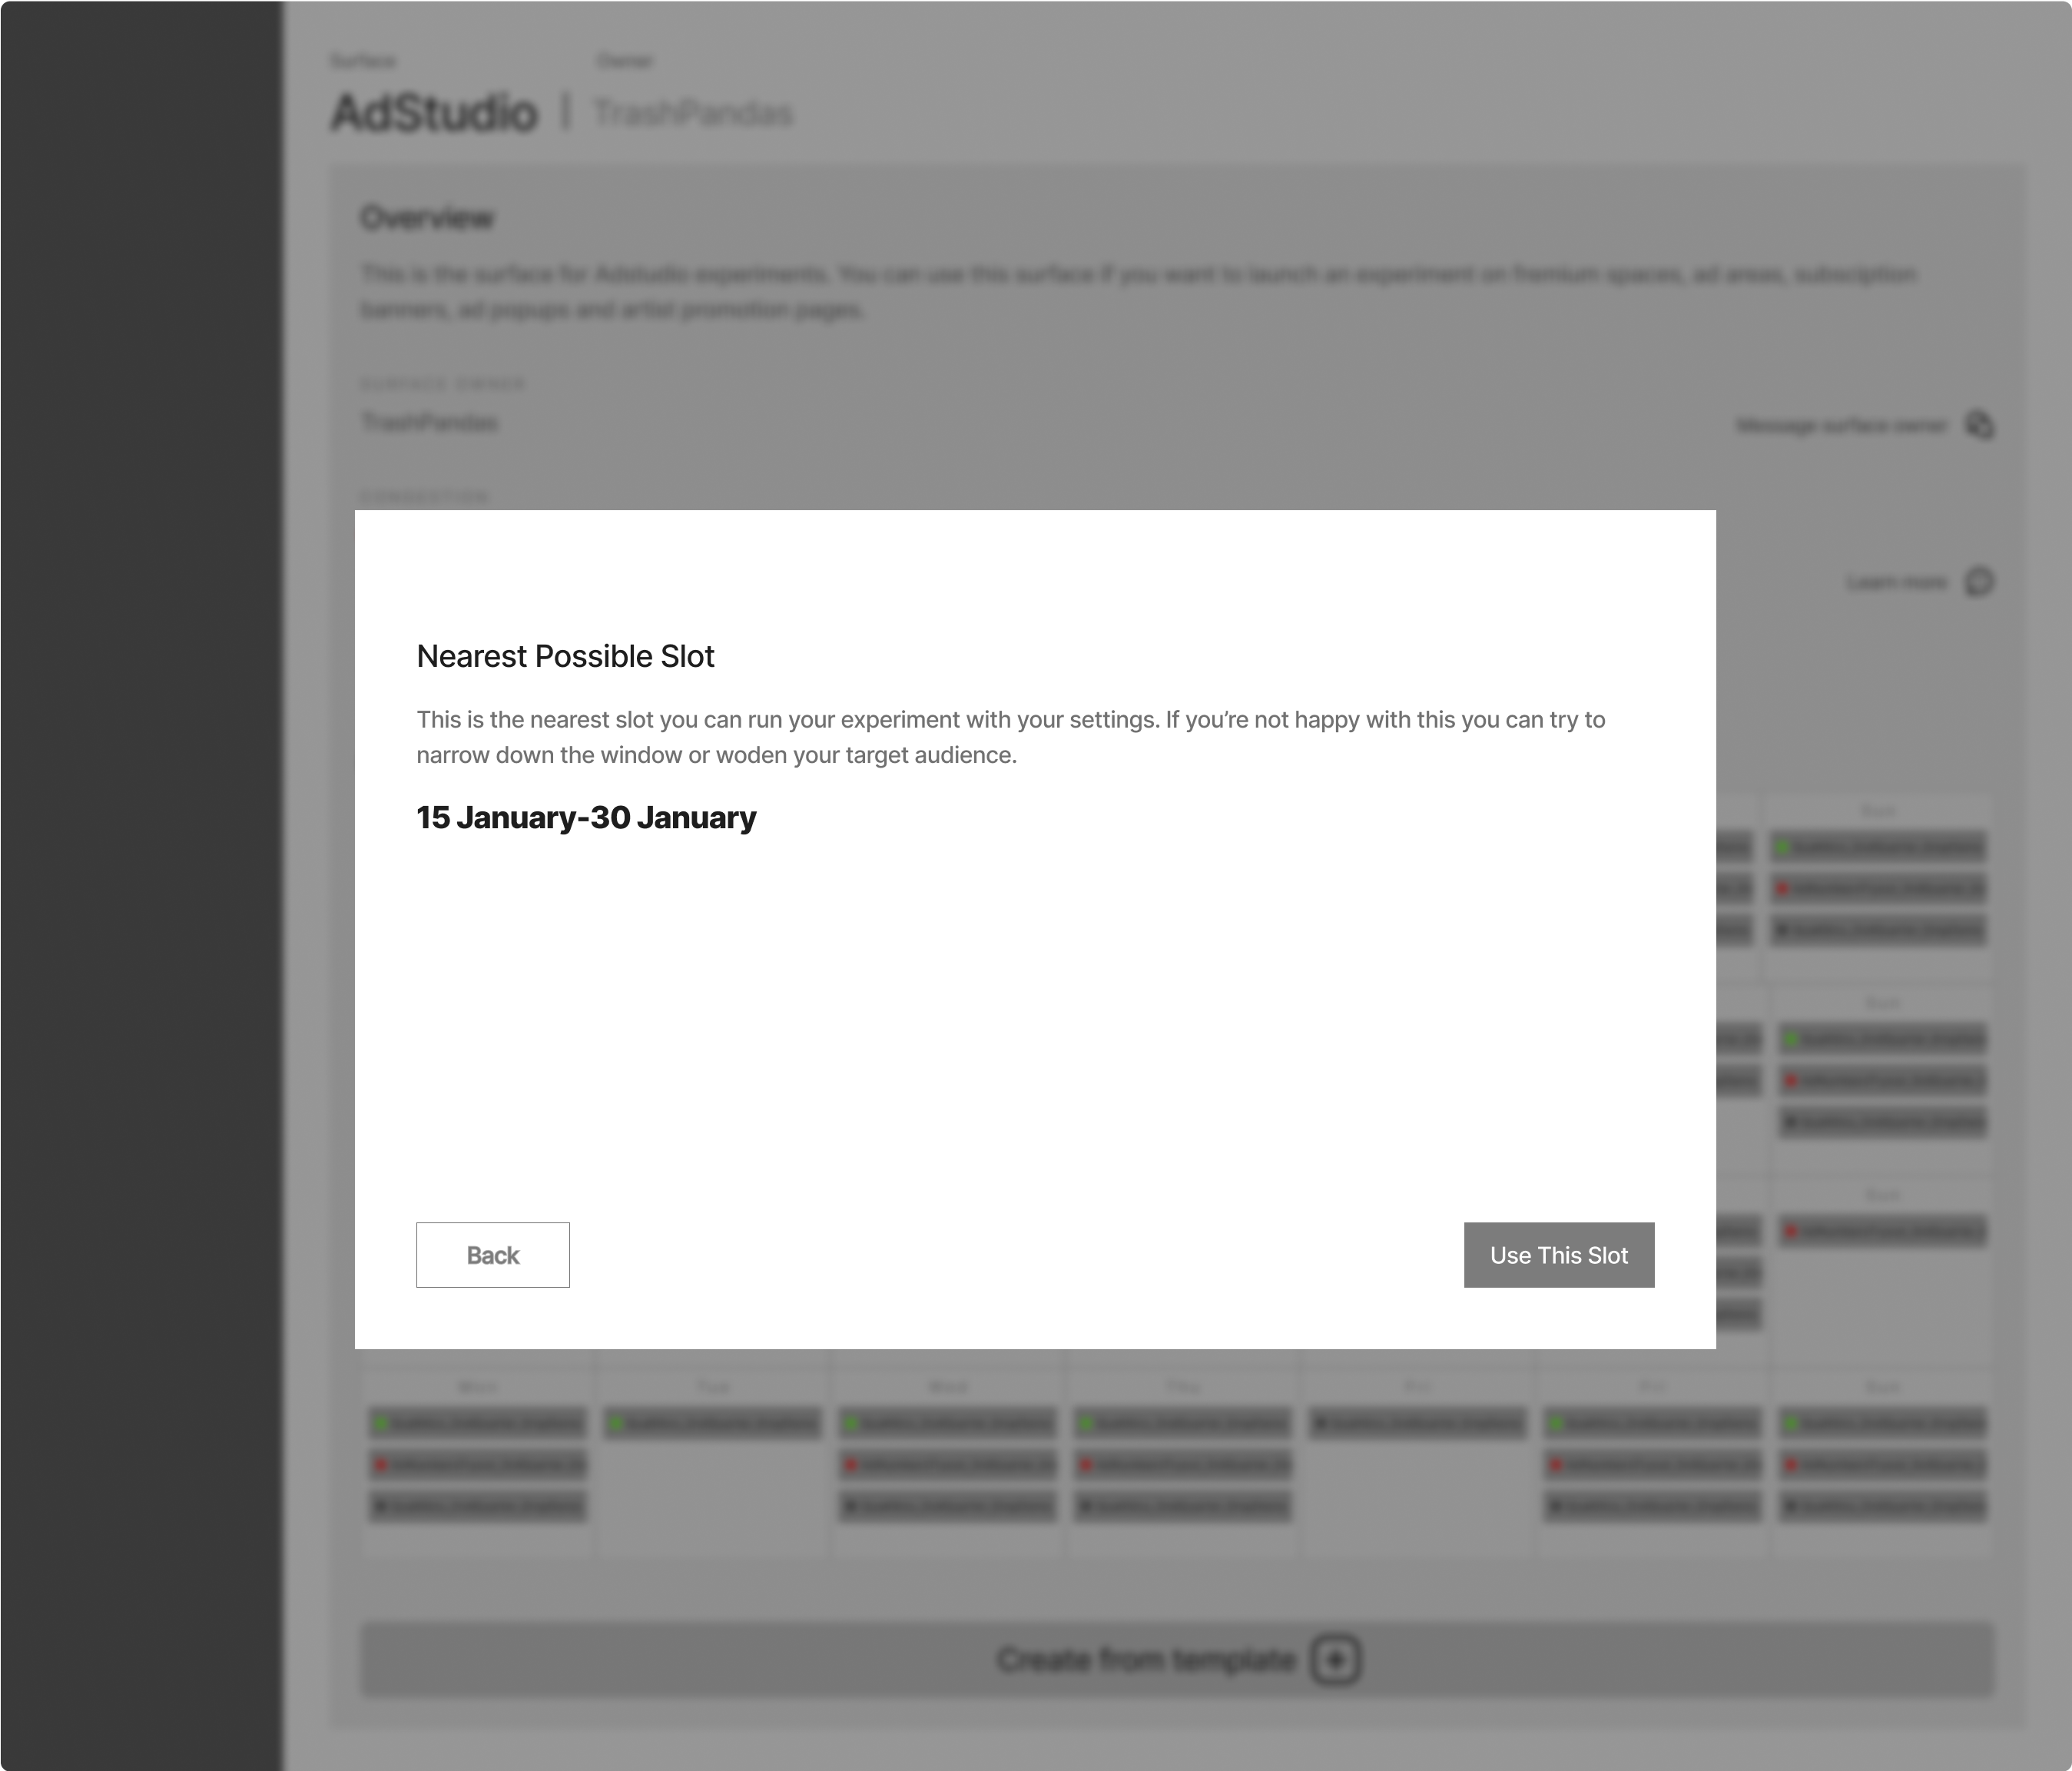
This was our step 1 approach for the problem at hand. Eventually, we planned to turn slot searching into a more straightforward action like a calendar search. In between we considered adding an email notification, and direct experiment configuration with this flow.
-More than 20 forms are filled in 2 month except from home (an approximate number decided upon experiments that are running on other team’s surfaces)
- A decrease in queries related coordination on our Slack channel
- Number of edited experiments that are launched, after the slot date is give
- Coordination is not stated as the biggest problem in the following survey
- Direct user feedback
Next Project

